print("Hello, welcome!")
## [1] "Hello, welcome!"Multivariate statistics
1 Course content
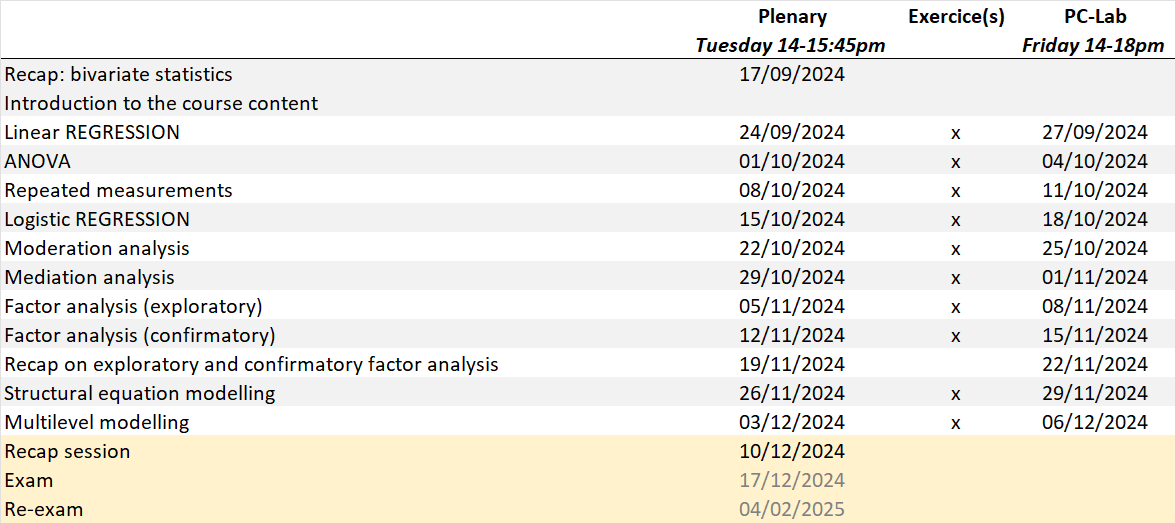
The course will cover the following topics and entails PC-Lab sessions with practical examples to familiarize with analysis of variance and regression analysis, which serve as a basis for many relevant statistical methods. The main goals relate to being able to understand the procedures in the foreground of each method (learn-oriented) and to address specific research questions (competence-oriented). More specifically, the course aims to provide you with the following abilities:
- In-depth knowledge of the most important methods of multivariate statistics
- Knowledge of the limits and requirements of the procedures
- Comprehending and calculating tasks/cases with R
- Interpretation of the empirical parameters
- Translation of questions/hypotheses into appropriate analysis methods
These abilities will enable us to assess the quality of scientific publications that are associated with multivariate methods, but also to attend special lectures and to acquire further multivariate methods autonomously.
The excel file also gives you an idea of the necessary prior knowledge and of the workload:
2 R programming language and RStudio
The course is taught using the R programming language. R offers a wide variety of statistics-related libraries and provides a favorable environment for statistical computing and design. It is used by many quantitative analysts as a programming tool since it’s useful for data importing and cleaning.
RStudio integrates with R as an IDE (Integrated Development Environment) to provide further functionality. RStudio combines a source code editor, build automation tools and a debugger.
2.1 Install R and RStudio
For this course, you are required to install both R and RStudio on your personal computer.
Install R:
- Download the last version of R for Windows or Mac (https://cran.r-project.org/)
- Save the installation file and execute it.
- Verify that the installation is completed and is working as expected.
Install RStudio:
- Download RStudio: open source version compatible with Windows or Mac (https://posit.co/download/rstudio-desktop)
- Save the installation file and execute it.
- Verify that the installation is completed and is working as expected.
You should see this logo on your Desktop:

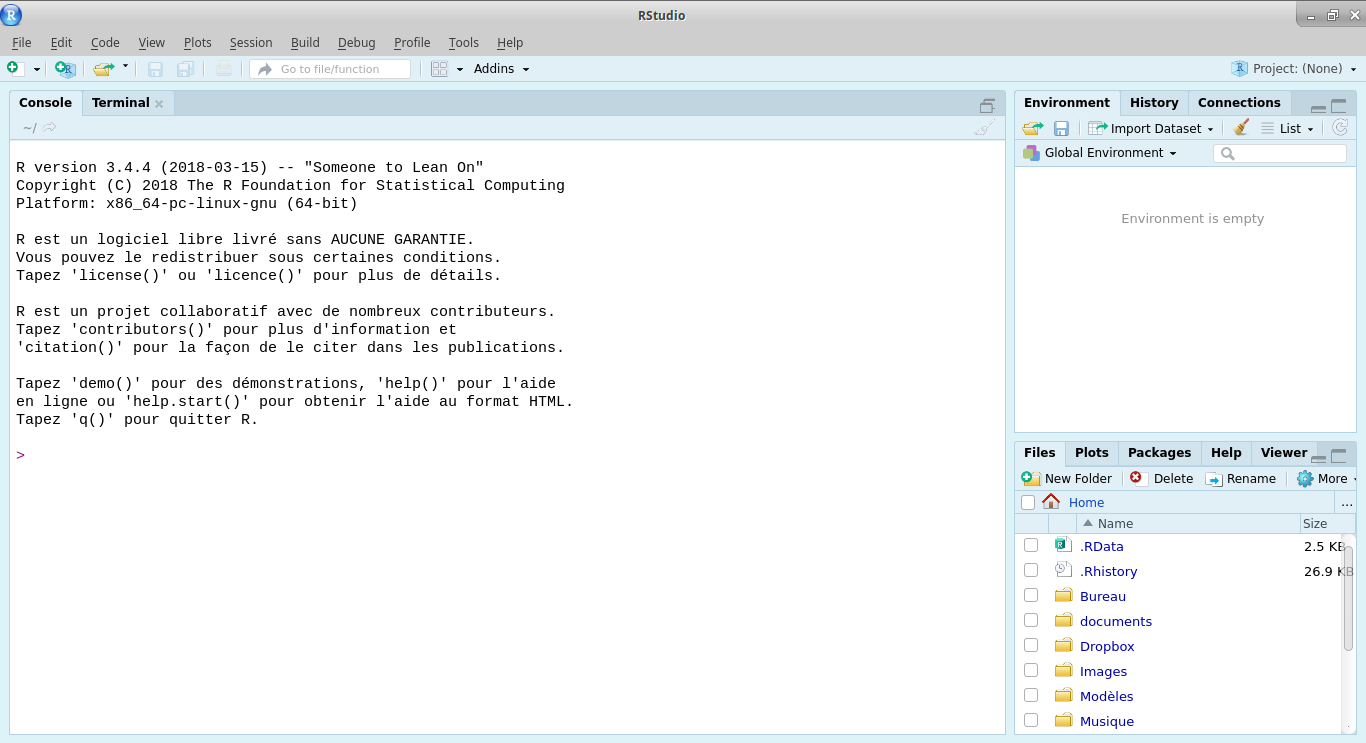
When opening RStudio, the following panes should be accessible to you:

You can verify that everything works as expected by typing the following code in the console:
2.2 Recommendations
In order to easily share scripts with other people using operating systems different from yours (without having problems, for example, with accents and other special characters), it is recommended to ask RStudio to encode the default scripts in UTF-8 (universal encoding):
Tools > Global Options > Code > Saving > Default text encoding and choose UTF-8
This manipulation is not useful for Linux users, who encode in UTF-8 by default.
2.3 R packages
In R, you have to load extensions (packages) that allow you to perform specific statistical operations. Each package is a sort of directory of functions, which you can install (only once is enough) and then call (as many times as you want) when you need it. We will be using different packages that will be most useful to follow the course. First, generic packages dedicated to basic statistical operations, to the manipulation and representation of data, and to the creation of automated reports are presented. Then, a short list of packages per family of methods will be provided.
2.4 Databases and external data sources
Several databases will be used during the exercise sessions (as well as for the demonstrations during the lectures). Most databases are data collected in the framework of (inter)national opinion surveys.
Concerning the Swiss data, you will be able to access the data immediately and free of charge on SWISSUbase. If you are not already registered with SWISSUbase, click here to register.
Cross-national opinion surveys are also available under the following websites:
- European Social Survey (https://www.europeansocialsurvey.org)
- World Value Survey (https://www.worldvaluessurvey.org)
- International Social Survey Program (https://issp.org/)
- Eurobarometer (https://europa.eu/eurobarometer/surveys/browse/all)
2.5 What’s next? Learning more stats
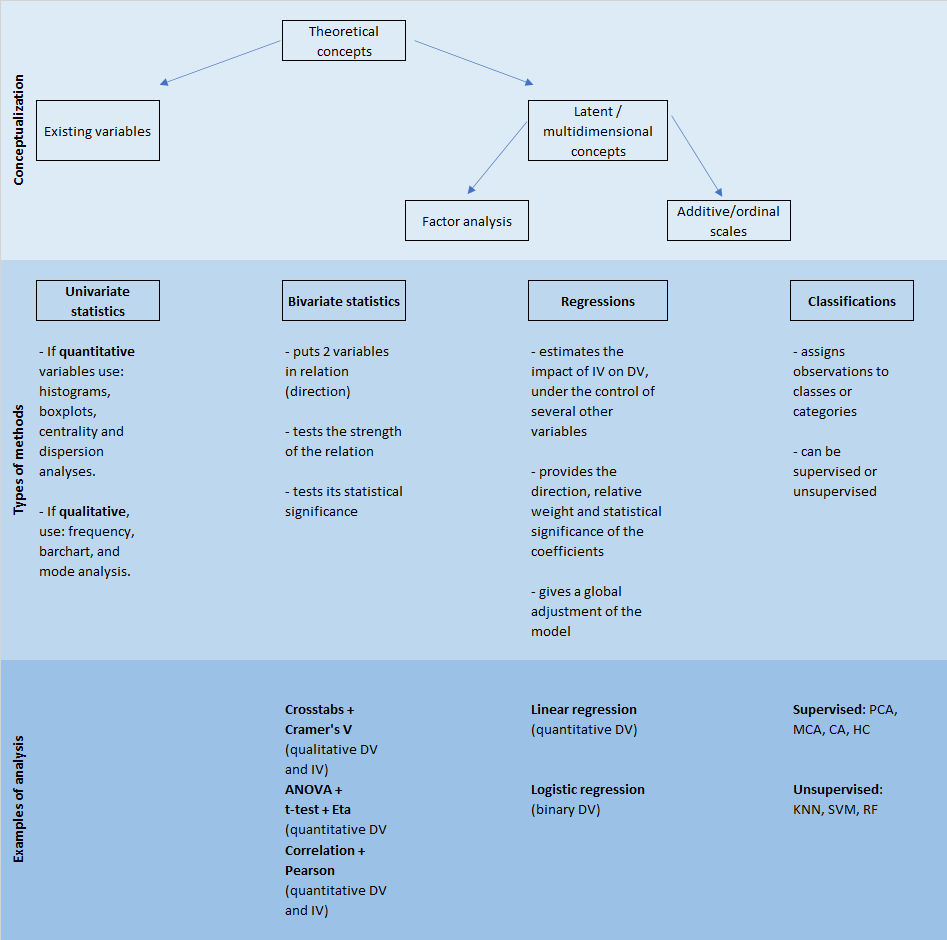
Univariate analysis consists of the analysis of only one variable. It thus deals with one quantity that changes, but not with causes or relationships. The main purpose is to describe the data and find patterns that exist within it. Furthermore, bivariate analysis involves two different variables. The analysis of this type of data deals with relationships among the two variables.
When the analysis involves three or more variables, it is categorized under multivariate. It is similar to bivariate but contains more than one dependent variable. The ways to perform analysis on this data depends on the goals to be achieved. Some of the techniques are regression analysis, path analysis, factor analysis, multivariate analysis of variance, and more.


